Gain Business Insights faster by generating Power BI Reports quickly with just 1 click in Dataverse
Hi All,
I’m going to show a useful feature that you can leverage to view and create instant Power BI visuals that is generated automatically based on the current view.
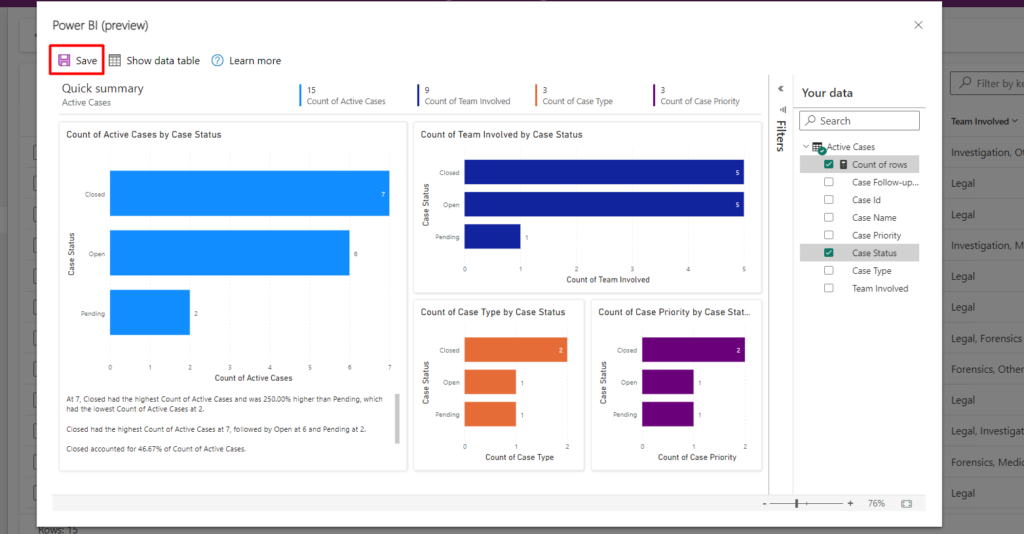
Just an example: How it looks
Steps to achieve this:
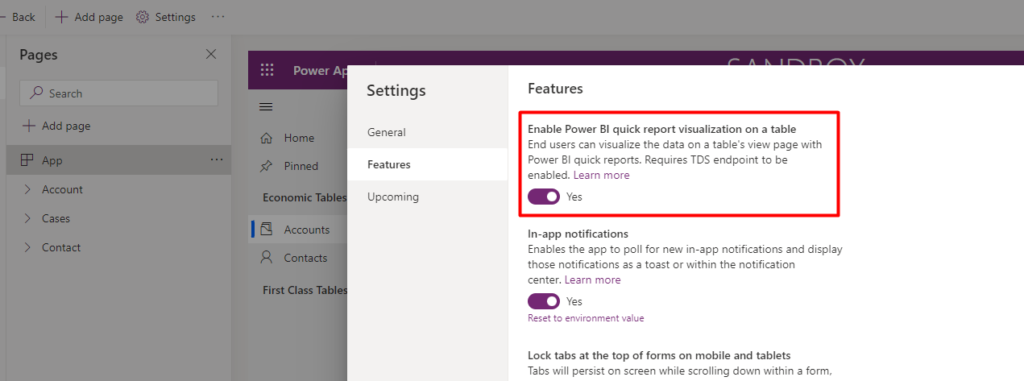
Step 1: You need to enable this feature in Model-Driven App itself
Edit Model-Driven App -> Settings -> Features -> ‘Enable Power BI quick report visualization on a table‘. Save and publish the settings
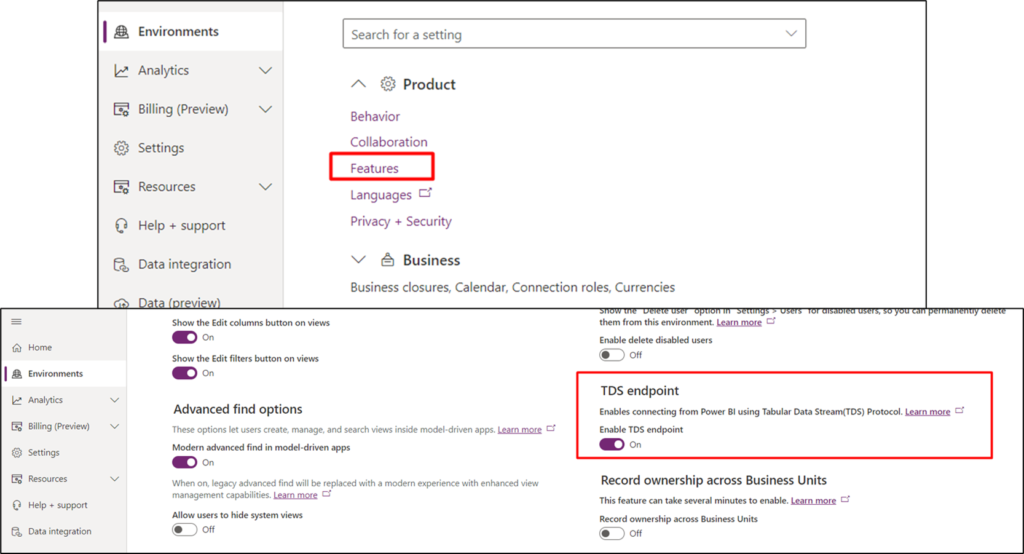
Note: You also need ‘TDS endpoint‘ enabled in the environment feature settings
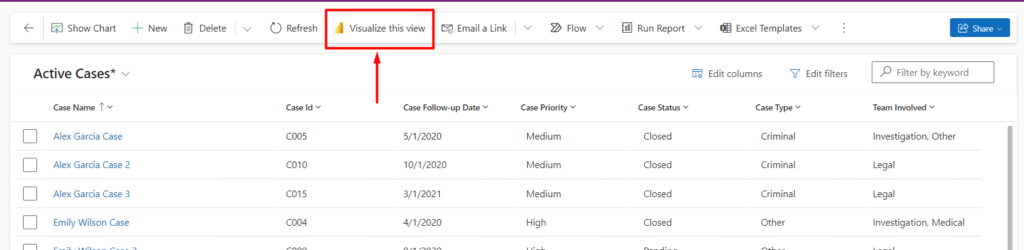
Step 2: Refresh your browser and navigate to any table records view ( I took cases in the example)
Step 3: Click the ‘Visualize this view‘ button on the command bar
Note: You need to add the necessary columns in the current view if you want to show those columns in Power BI Reports
Step 4: You can now see the Report generated automatically within a few mins.
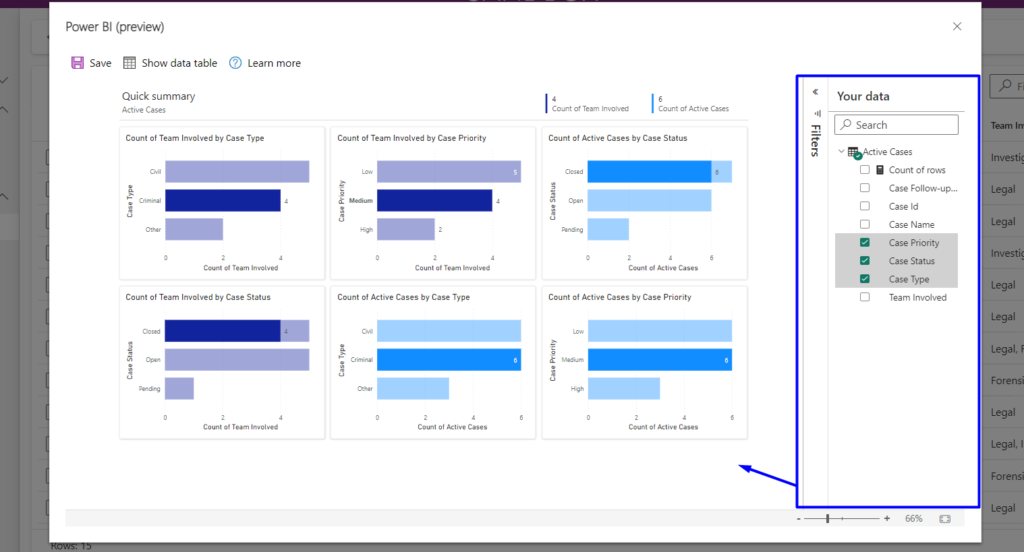
You can save these Reports if all necessary information is displayed here.
Hope this helped you get faster Business Insights with auto-generated Power BI visuals.