Applying Pivot Table in Excel using Automation Server Objects in NAV
Introduction:
In NAV when building a custom report that deals with totalling the amount by multiple G/L accounts by week then the report becomes tough to read as well as develop in standard SSRS Report. A possible and easy workaround is dumping all the entries in the Excel and performing the pivot table operation on the entries to give a precise results.
Pre-requisite:
Microsoft Dynamics NAV 2017
Demonstration:
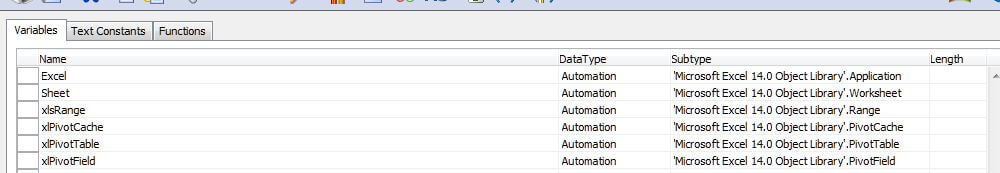
1. List of Variables:
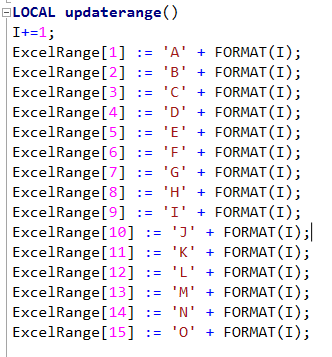
2. UpdateRange function to automatically update the sheet range of the current row:
3. Creation of Excel Entries Sheet:
- Creation of Excel Sheet:
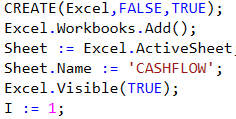
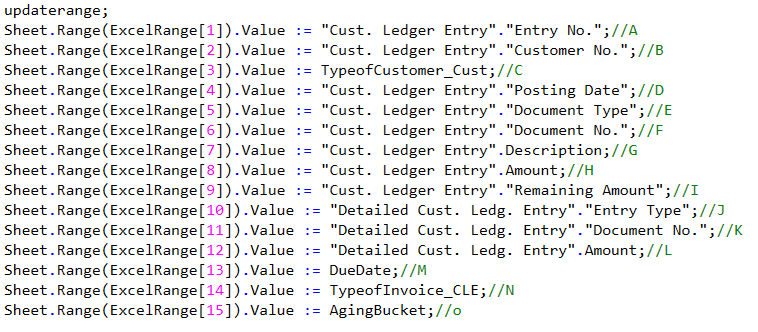
Simple Creation of Blank Excel Sheet - Creation of Column Titles:
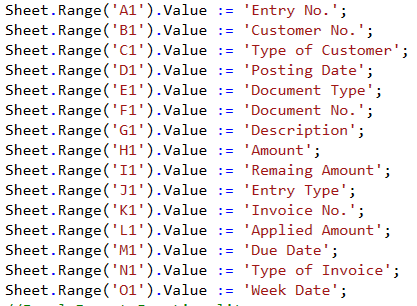
Inserting the Column Titles to the created ‘CASHFLOW’ excel sheet - Insertion of Data Entries:
Set the range to next row and Insert Entry
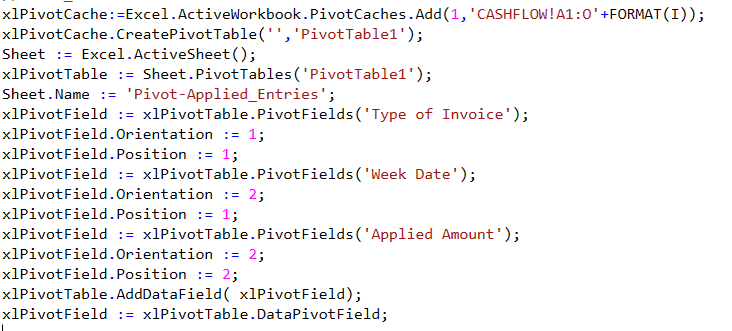
4. Pivoting the Data from the sheet containing entries:
Pivoting operation in Excel takes place with the help of Pivot Cache. This Cache is modified using the Automation Variable.
Conclusion:
The method of using Automation Variable is allowed in On-Prem version of NAV, as it uses Excel libraries that already installed with Microsoft Office. Although this method works perfectly fine Windows Client, it does not work on WebClient. Thanks for reading!!